Project DESCRIPTION
The Los Angeles County Museum of Art (LACMA) has been devoted to collecting works of art that span both history and geography, mirroring Los Angeles's rich cultural heritage and uniquely diverse population. Today LACMA is the largest art museum in the western United States, with a collection of over 135, 000 objects that illuminate 6,000 years of art history from new and unexpected points of view. Their mission statement is to serve the public through the collection, conservation, exhibition, and interpretation of significant works of art from a broad range of cultures and historical periods, and through the translation of these collections into meaningful educational, aesthetic, intellectual, and cultural experiences for the most extensive array of audiences.
Our Challenge
LACMA hired our team to improve the overall museum visit experience by enhancing the way, the information about the museum was presented to the visitors. This information includes maps, dining menus, services available, and artifact information. This information will allow the visitors to make better decisions in regrades to their visit. It will also make it easier for the visitor to learn more deeply about a particular artifact they find interesting within the museum.After meeting with the client, our team design vision is to improve their LACMA mobile app by solving the problem of:
Planning a visit
Searching the collection
Discovery of new art
Learning additional information about the art
Saving memorable parts of the visit
The design vision for the system is to make a visitor’s trip as comfortable as possible. The scheme was to dampen any visitor confusion and anxiety. The system will locate and navigate the visitor throughout the museum so visitors do not become frustrated when they cannot find a specific piece of the art collection. The system will also minimize the time a visitor spends doing tedious tasks such as waiting in lines at the valet or gift shop and renewing a museum membership.
My Role
User Research, User interviews, Data Analysis, Persona Creation, Card Sorting, Conceptual Model, Journey map, Navigation Map, Usability Evaluation
Timeframe
8 weeks
Team
Khanh Nguyen
Jimit Shah
Lynda Rollins
User Research
After our team completed the contextual inquiry, we identified two user classes: experts and novices. These users are considered to be experts if they have visited three or more museum in the past year. Novices are users who have only visited a museum once or twice in the past year. The primary requirement for user selection was that a user had visited a museum in the past year. This inquiry has multiple users that represent both user classes. Selected users also vary in the occupation industry, age range, and gender to see if these demographic factors could provide additional insight. In all our team conducted eight contextual interviews, three experts and five novices.
Data Analysis
After we conducted our eight contextual interviews, we transcribed them and uploaded our data into the Stormboard app. An application that allowed us to dissect our participant responses quickly. A recurring observation across the multiple inquiries was that all participants used the informational materials provided by the museum and that the information regarding specific artifacts was easy to find. Nearly all of the users visited a museum as a social activity. Many of the users also noted that their favorite part of the visit was the lack of a large crowd. One user, in particular, cited crowds as in issue for viewing not only an artifact but the accompanying information. The user also noted a social pressure to hurry when reading the artifact information, since he/she did not want to block it from other visitors. None of the inquiry subjects cited additional seeking information from a person, such as a docent.
Affinity Diagram Detailing Pain Points
Insights
While a museum visit was a social activity for almost all of the participants, the social aspect of it seemed to be a priority for young novice visitors in particular since they visited in groups of 3 or more people. In contrast, experts typically visited in small groups. Many participants choose to attend because a friend recommended them or saw an ad. Experts usually had a targeted approach to their visits, while novices were more casual with their visits. Both groups seemed to prefer weekend visits. Purchases, when made, were made more by experts. Crowding is the biggest issue for subjects during their museum visits, and although both groups made use of the information available, most experts would like to see more accessible information on exhibits and both groups would enjoy more options.
Insight clusters
Large crowds in a museum diminish the museum experience and make it more difficult to obtain information about an artifact. The social nature and purpose of a visit were different between the two user classes. Novices typically visit as a way to socialize, whereas experts visit due to a keen interest in the artifacts available at the museum. The social aspect of the museum visit extends beyond the visit itself since everyone took pictures, if allowed, and used those pictures to share his or her experience with people who were not there. Both user classes were divided when it came to how visitors crossed the displays. Typically, novices wandered around while experts took a more targeted approach, going to displays of interest first before exploring the rest of the museum. When it comes to more information people tend to use whatever they have at hand instead of asking for it; in this type of situation, the LACMA Integrated Experience project could provide more information without the visitor having to ask someone.
personas
Developing the models and determining the requirements of the LACMA Integrated Experience system began with the personas. The two personas, journey map, and conceptual model were created based on the data and user classes from our affinity diagram. The Affinity diagram became the foundation for our design framework and task flow creation.


Journey Maps
Since the expert persona had more of an exciting narrative, we decided to use Christine as the subject of a journey map. Defining the events of the expert’s journey was rather straightforward, and the persona definition helped determine the emotional experience level of each activity on the journey map. Some of the events on the map were repetitive, so they were combined with other activities. Below you will find our first journey map and second journey map that focused on expert persona Christine showing her emotional experience level.
Our first Journey Map

Our Modified Journey Map after review (Christine’s Journey)
Conceptual Model
To understand the different type of information the app needs I decided to create a conceptual model. This helped us to determine the requirements for the page designs and help us with figuring out the structure of the design. It helped us with the scope of the project and to determine what parts of the app to build at the beginning of the process.
Card Sort
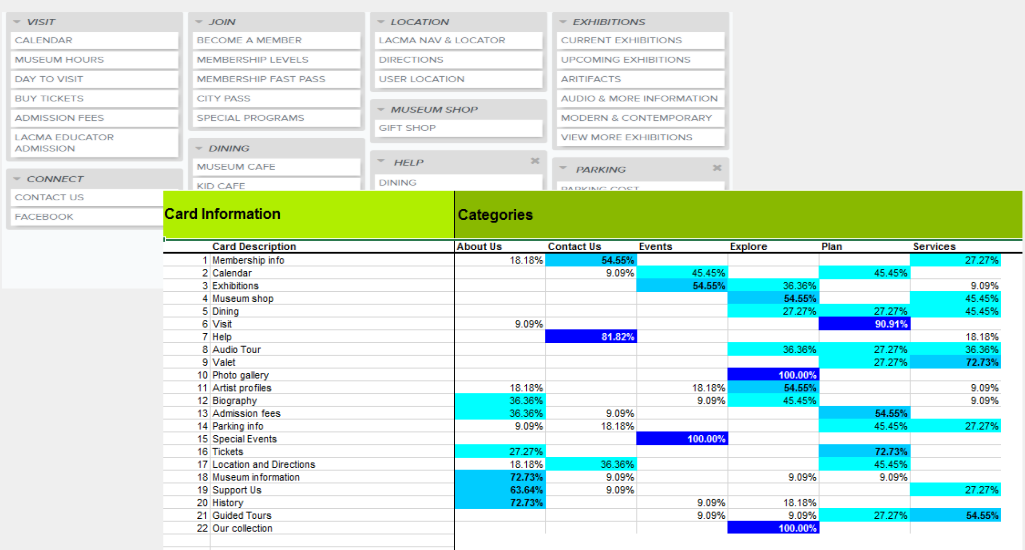
Our card sort process helped us with what we were going to add on our cards and add for our categories. We decided to use the web-based tool optimalworkshop.com to complete our close sort and analyze our data. I added our categories to the cards for our study, and then we recruited our participants. We recruited 11 participants in all; few them were teachers through work, friends, and a few students that attended our university. The participants included were experts and novices that were both familiar with visiting the museum. After analyzing our data, we realized that many of our participants agreed more than they disagreed when it came to the placement of the cards for most of the categories. The similarities in the results between the participants in our analysis spreadsheet showed us that between 55% and 100% of the participants agreed with each other’s organization schemes. The participants with differences on the spreadsheet were between 9% to 46%, so we recognize that some of these results were not going to be used on our Navigation map.
Navigation Map
By analyzing Christine’s journey, we were then able to narrow down the features via card sorting. We created a sitemap to organize the pages and to give meaning to the defined features of the app.

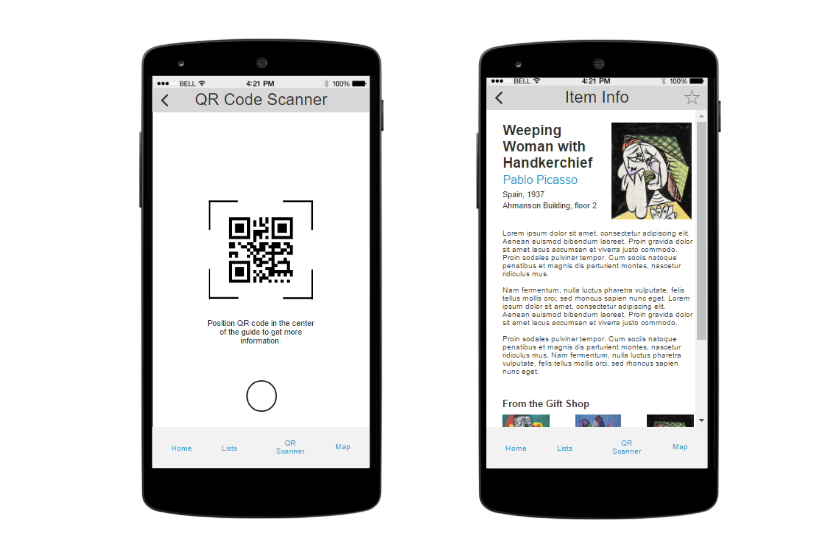
Wireframes

Usability Evaluation
We conducted a usability test with six of the original contextual inquiry participants, which included three experts and three novices. The task scenario for each user class focused on the task they would perform during their visit to LACMA. Our usability test was conducted at the participant's homes, library, and workplace. All of our usability evaluation was completed on a laptop or desktop devices with a mobile app simulator. These conditions, while useful for evaluation purposes, are not equal to using an actual app on a mobile device. You can see our task scenarios and data evaluation below: